In-depth data, statistics and analytics are essential when it comes to reaching the right audience online, and delivering real, measurable growth for your brand or business. It’s essential that you know where, when, how and why people are browsing online or using social media. This way, you can best leverage the opportunities presented by these trends. So, we’ve collated some of the latest global internet usage statistics so far in 2020.

Browser Market Share Worldwide in 2020
Desktop Browsers
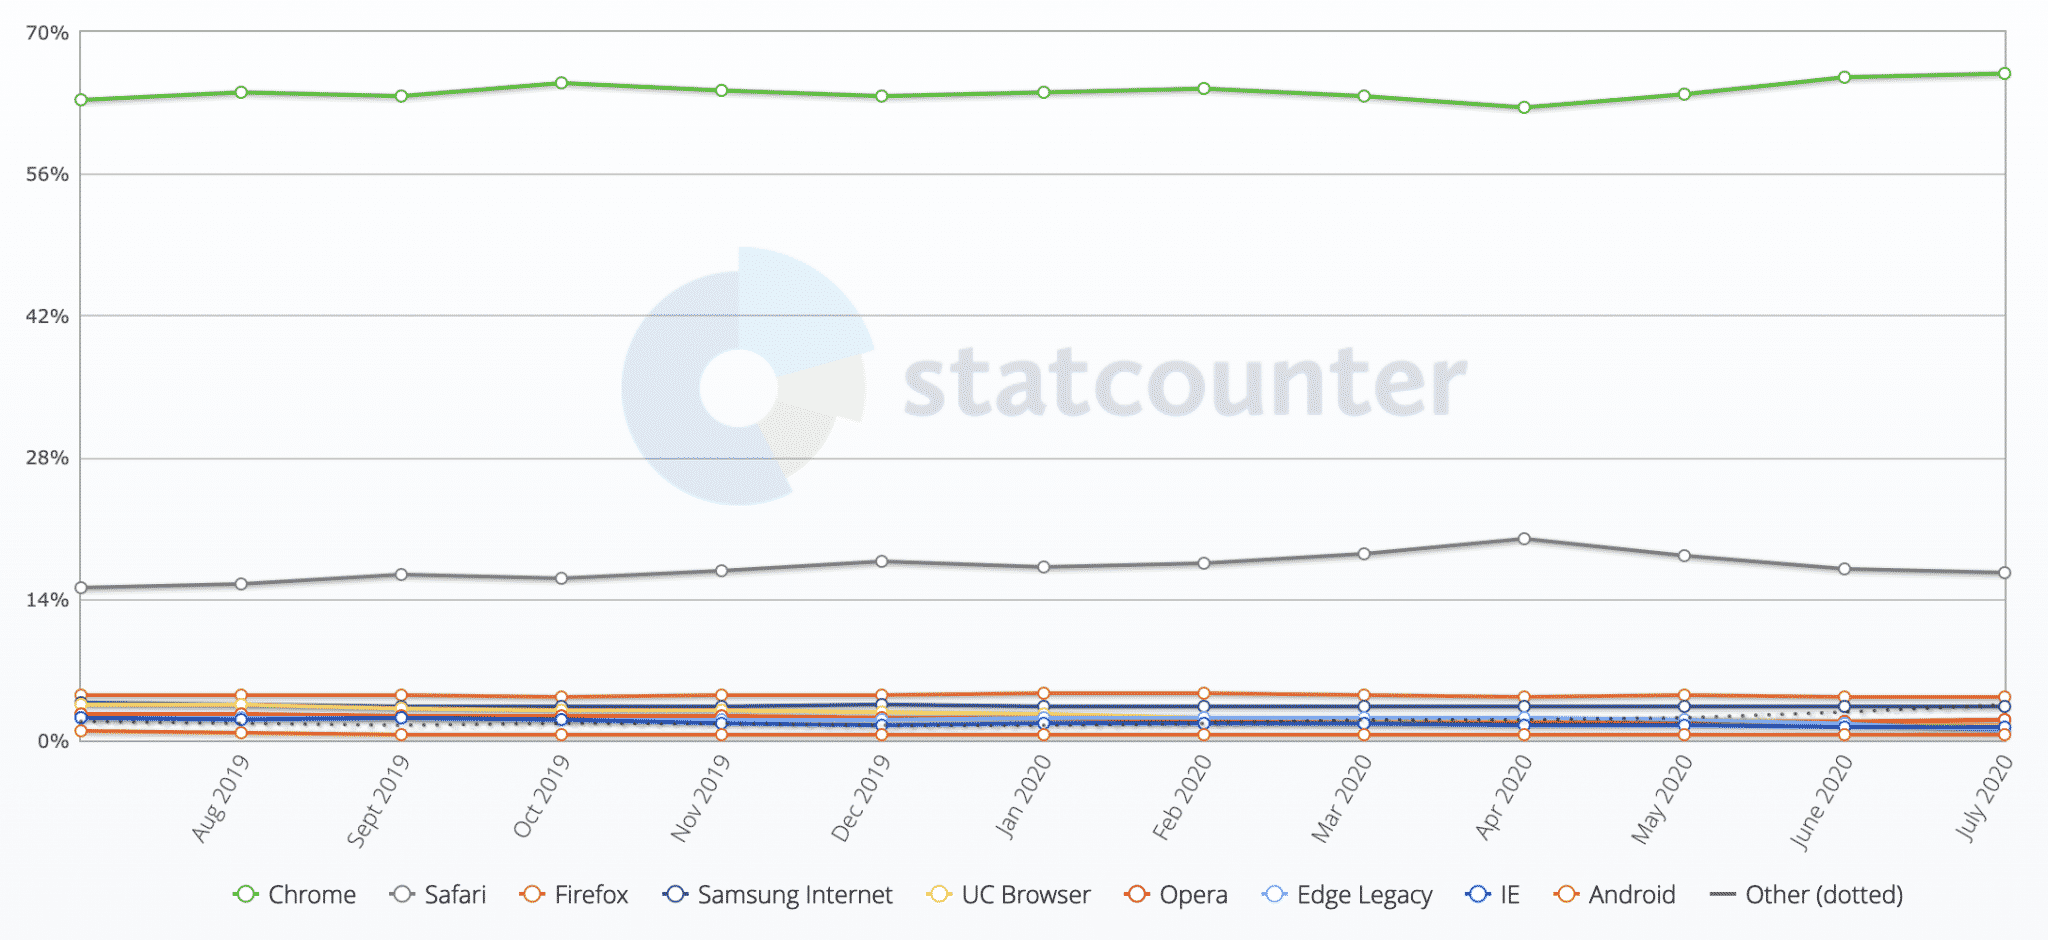
In July 2020, two thirds of people use Chrome as their preferred desktop browser. Safari comes in at second place with a 17% market share. Good web developers and designers should be designing sites to meet web standards so that sites will function seamlessly between browsers. At the very least, they should be testing the user experience in at least Chrome and Safari.
Source: StatCounter
So, why is Chrome king?
Google develops Chrome, and since they’re the most dominant search engine by a country mile, they have enormous reach. Chrome is also fast, user-centric and easy to develop for. It has endless extensions, which make work and play easier and it displays HTML5, CSS3 and JavaScript seamlessly. It’s good for developers and users.
Mobile and Tablet Browser Share
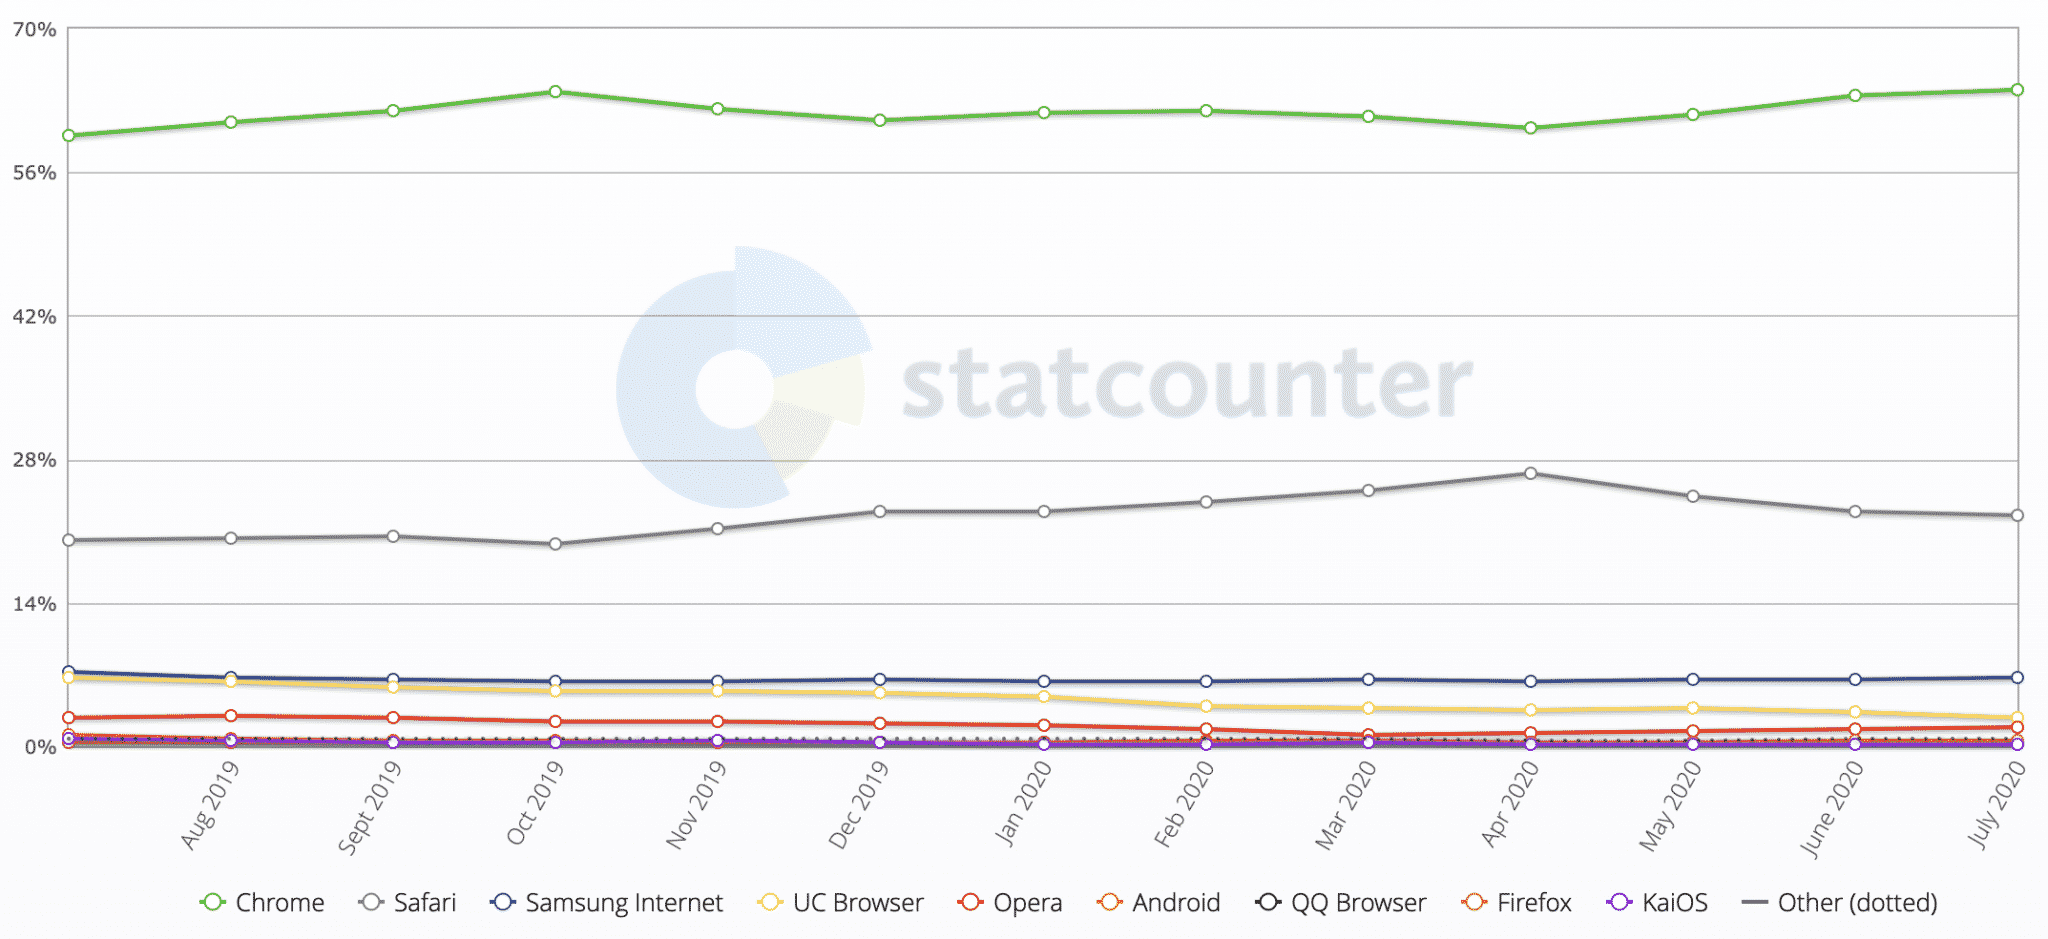
Chrome is also the most popular browser on mobile with just over 60% market share (with Safari usage to 23% market share in July 2020).
Source: StatCounter
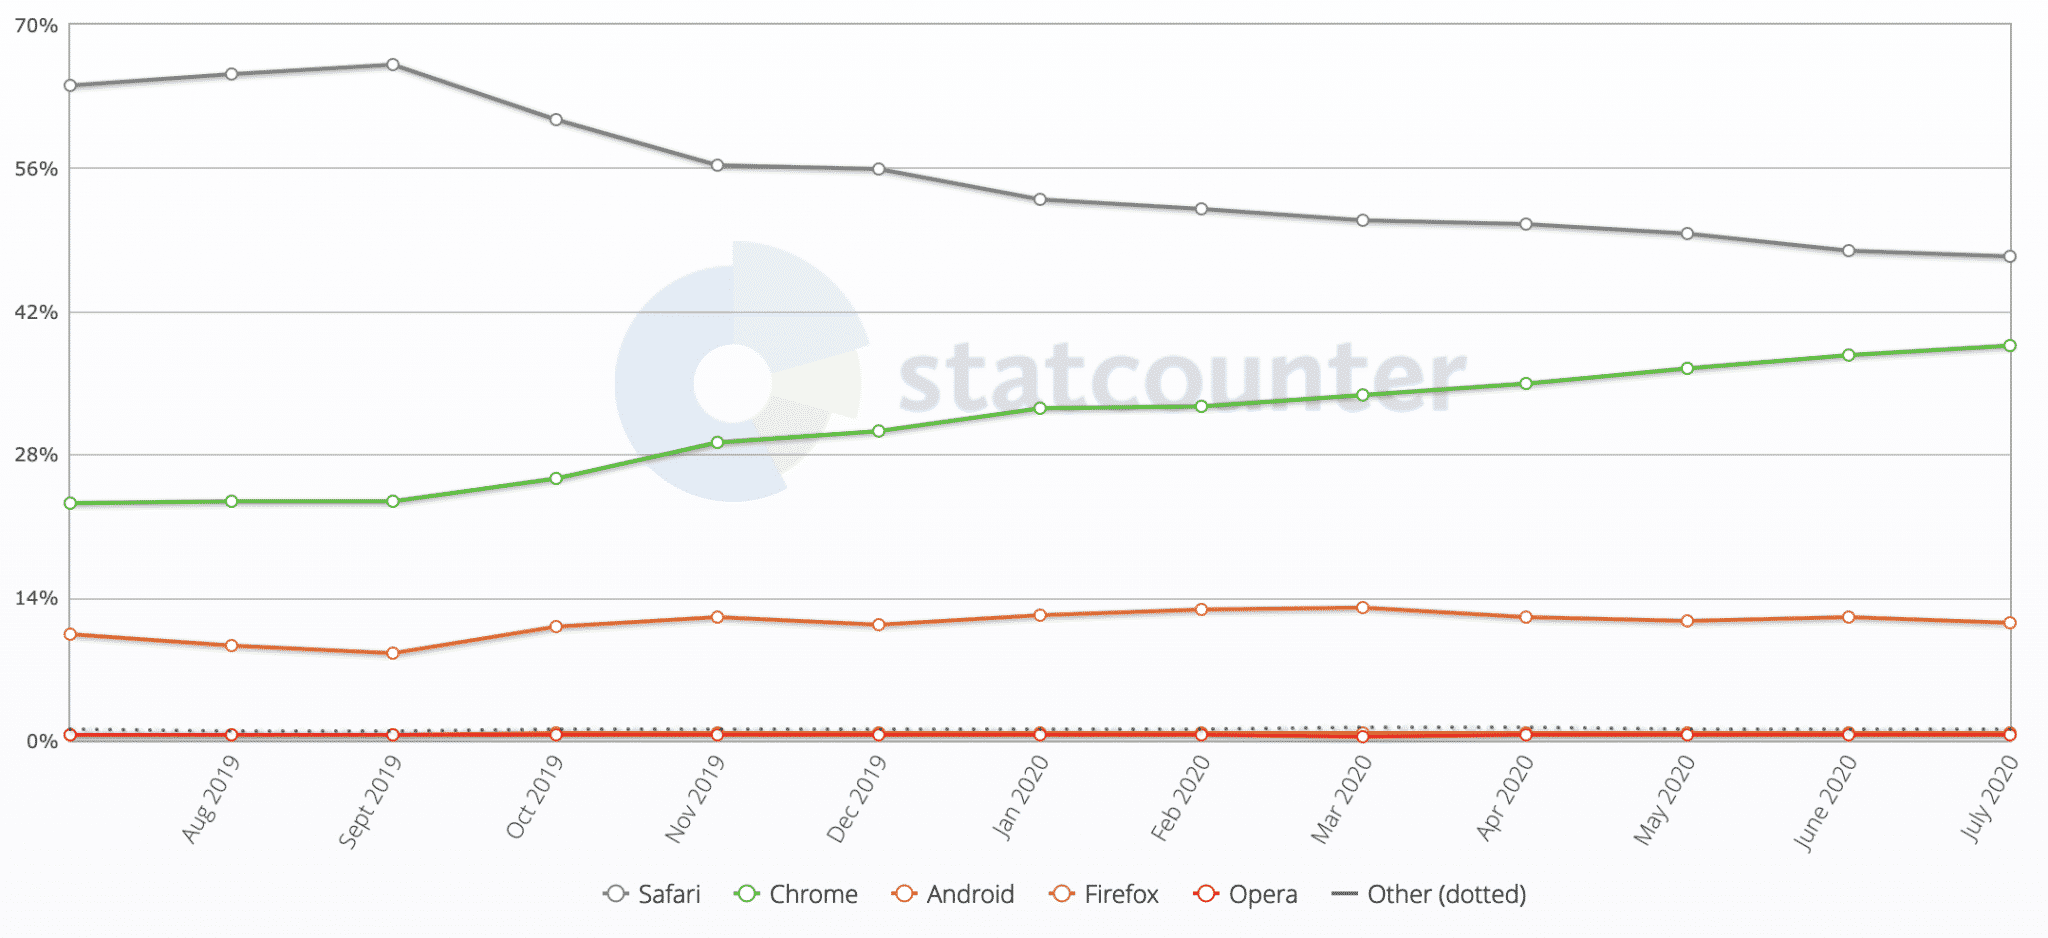
Apple’s historical dominance of the tablet sphere makes Safari the most popular browser for tablets at 47% market share (with Chrome rapidly gaining more traction over the past year to 39% market share).
Source: StatCounter
Key Takeaway
What does all this mean for you?
Well, you should make sure when performing user testing on soon-to-be-launched (or just updated) websites that you test everything works as planned on any browser and on any device or at the very least cross device and in the most popular browsers of Chrome and Safari.
So, we know which browser people prefer to use, but what devices are they using?
Device Market Share in 2020
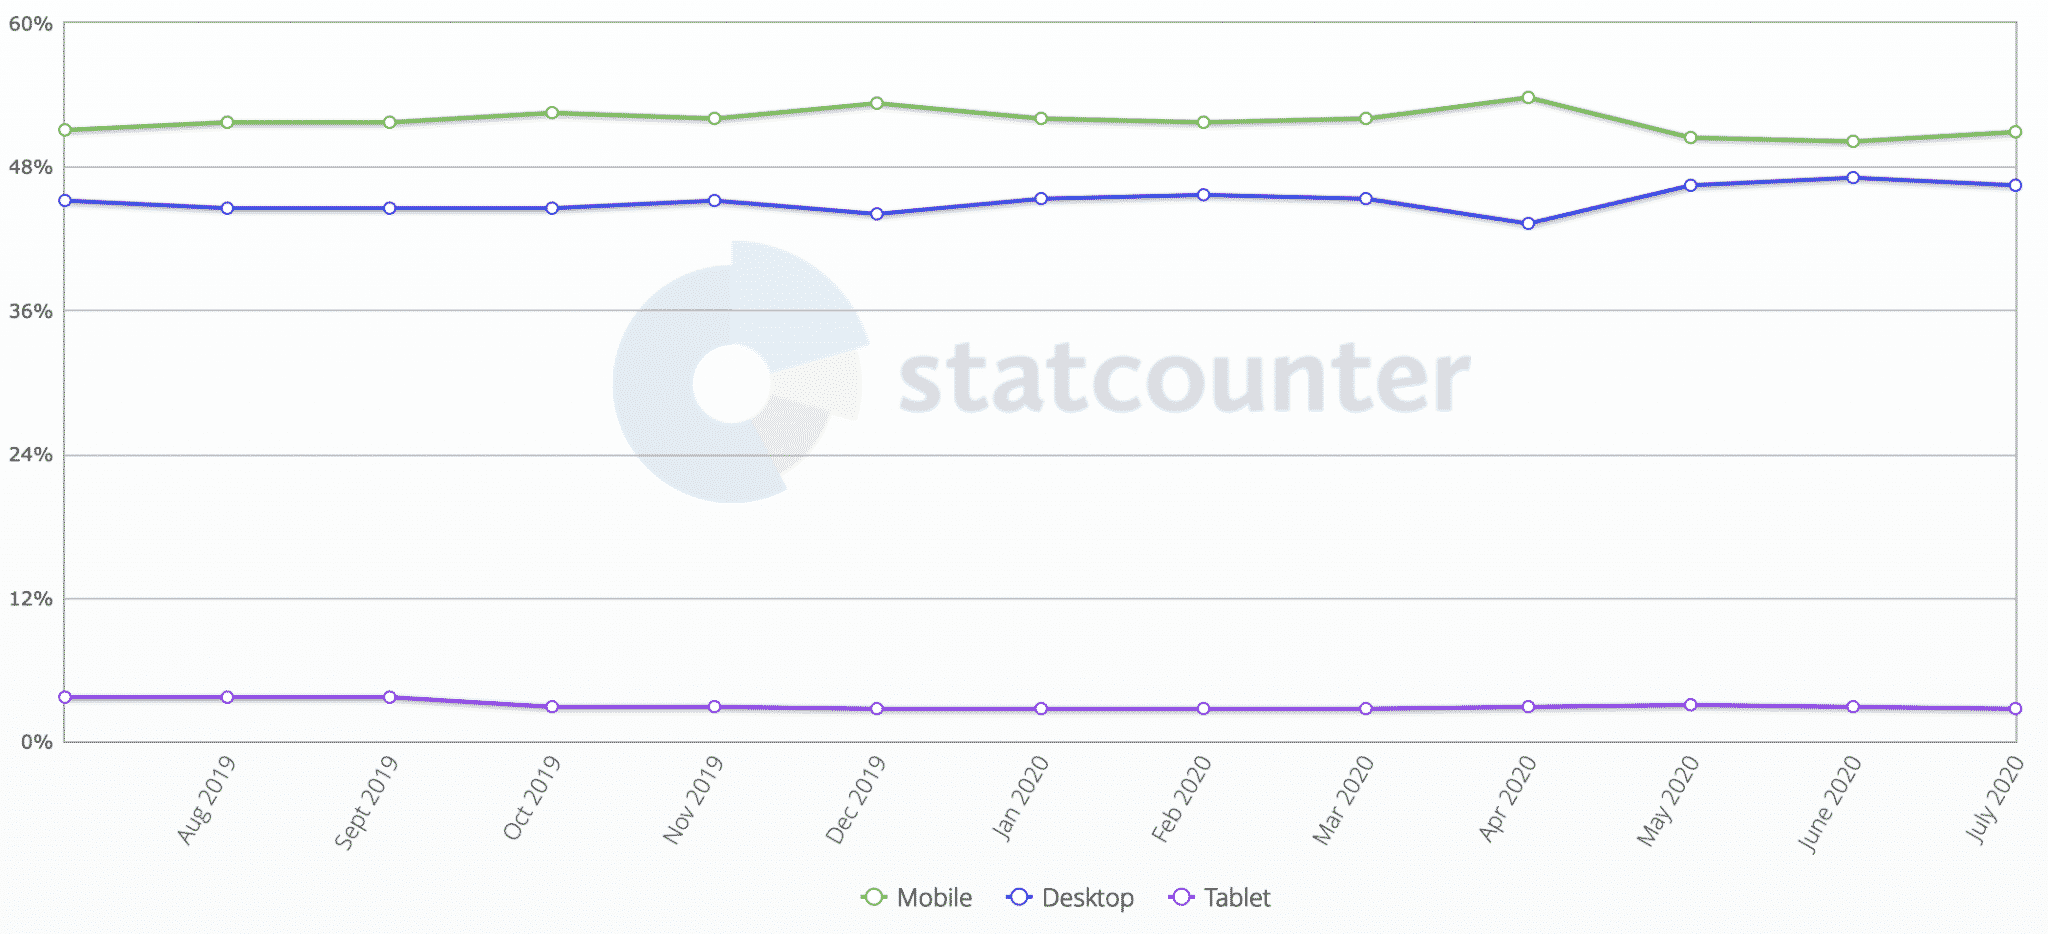
In July 2020, mobile has the largest market share at 51%, compared to desktop’s 46% share. Tablet usage is still comparatively low, at 3%.
Source: StatCounter
Key Takeaway
We’ve all known it for a while now, but the data just reinforces the fact: websites must be responsive so they work well on any device and in particular on mobile.
If your site only works for desktop users, you could be turning away almost half of your potential traffic. Your website needs to work for every visitor. The best way to do this is to create a responsive site and tailor content to give users the best possible browsing experience.
Content Management System (CMS) Usage Distribution in 2020
A Content Management System (CMS) is the platform used by developers to build and organise websites.
WordPress has the largest market share, with 44% of the top 1 million websites.
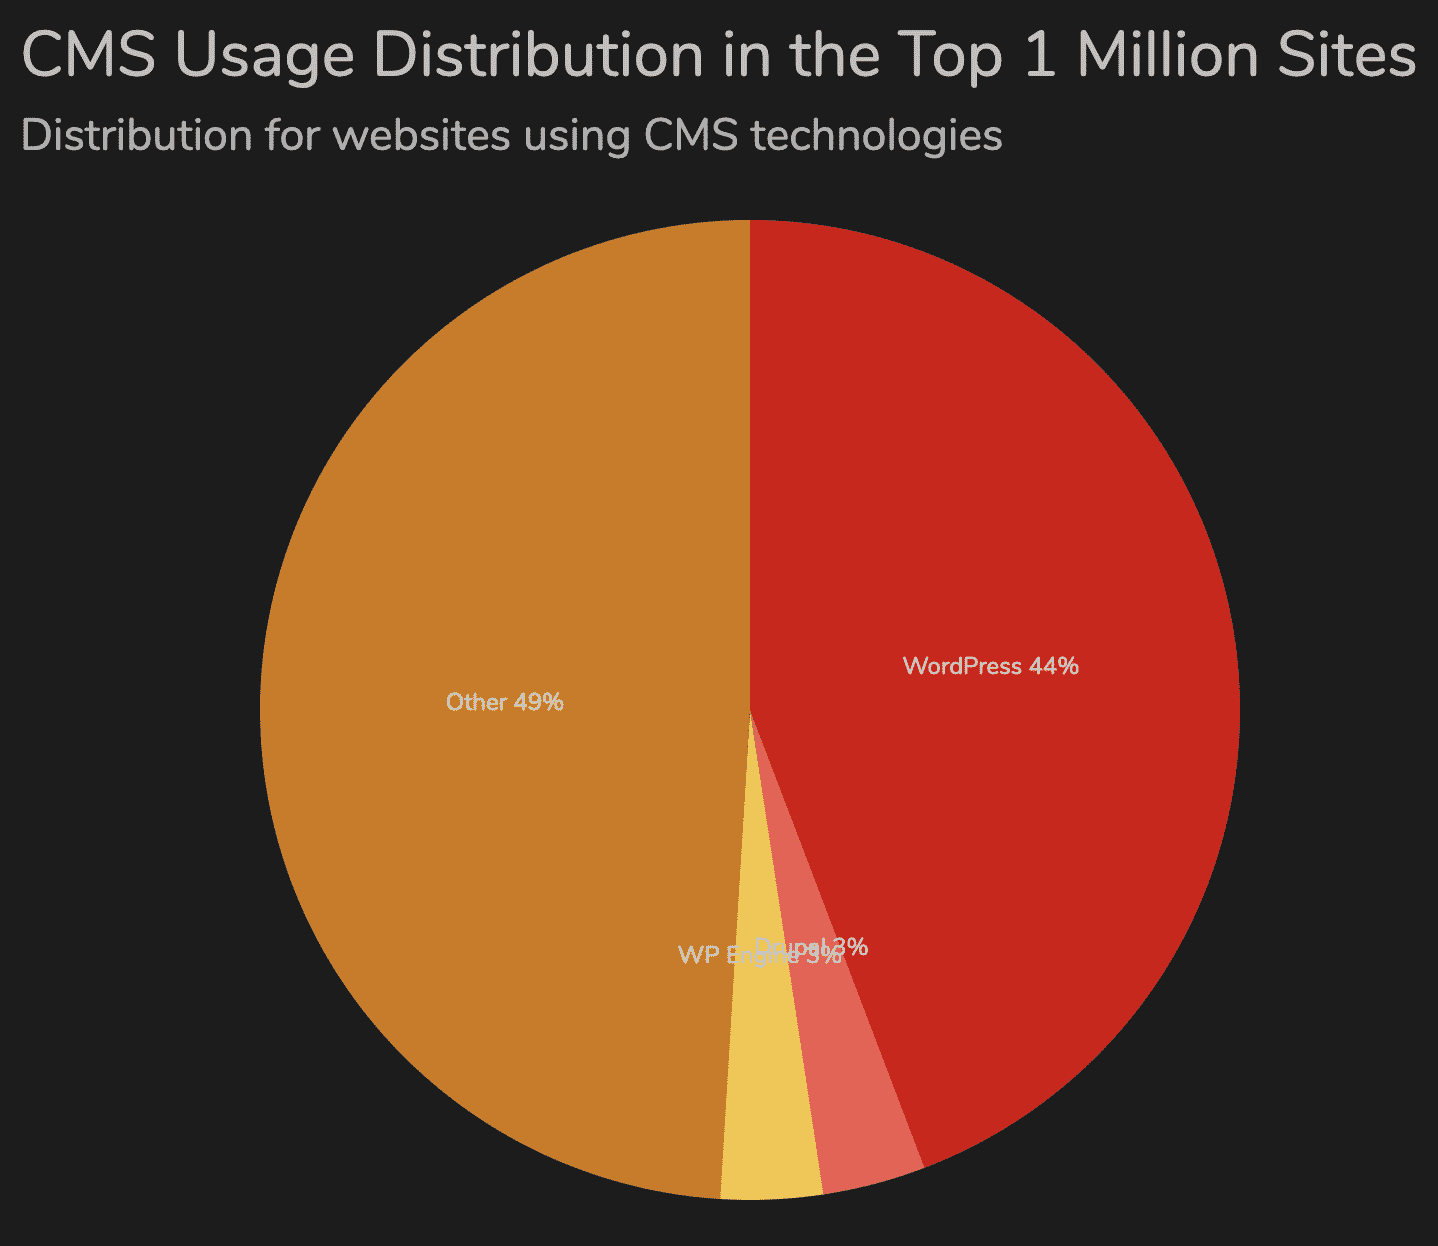
This market share demonstrates the significant popularity of WordPress. WordPress is an actively supported Open Source software platform we typically recommend for business websites both big and small. It has a large community and ecosystem around it making it a popular choice not only in Australia but also globally.
eCommerce Platform Usage Worldwide in 2020
WooCommerce is the most popular eCommerce platform for the top 1 million eCommerce sites around the world. Both Magento and Shopify also have a healthy share of the eCommerce market.
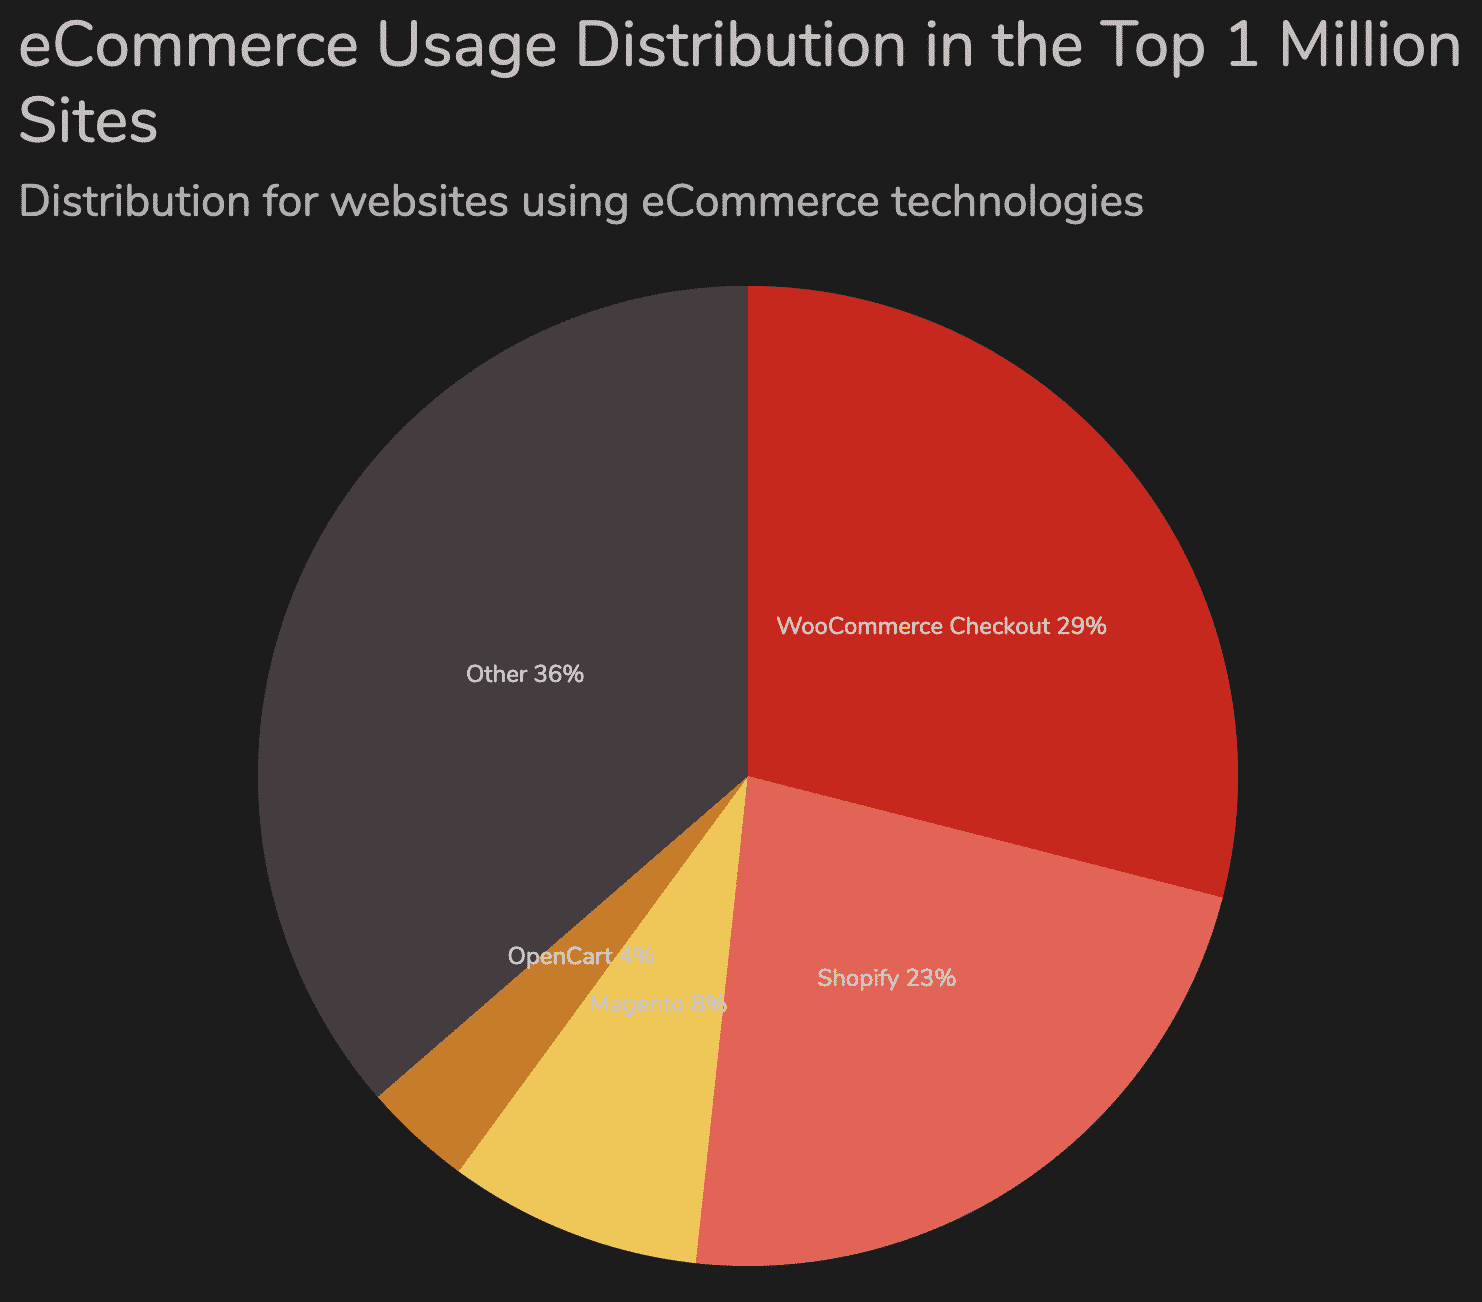
WooCommerce is a plugin for WordPress that provides eCommerce functionality within your WordPress website and has a range of extensions available to provide popular additional features such as gift vouchers and subscriptions.
2020 is the perfect time to move into eCommerce. Nearly two thirds of all shopping occasions begin online (Source: Think With Google). Globally, the eCommerce market is predicted to increase by more than a quarter with a 10% increase in users year on year in 2020 (Source: Statista).
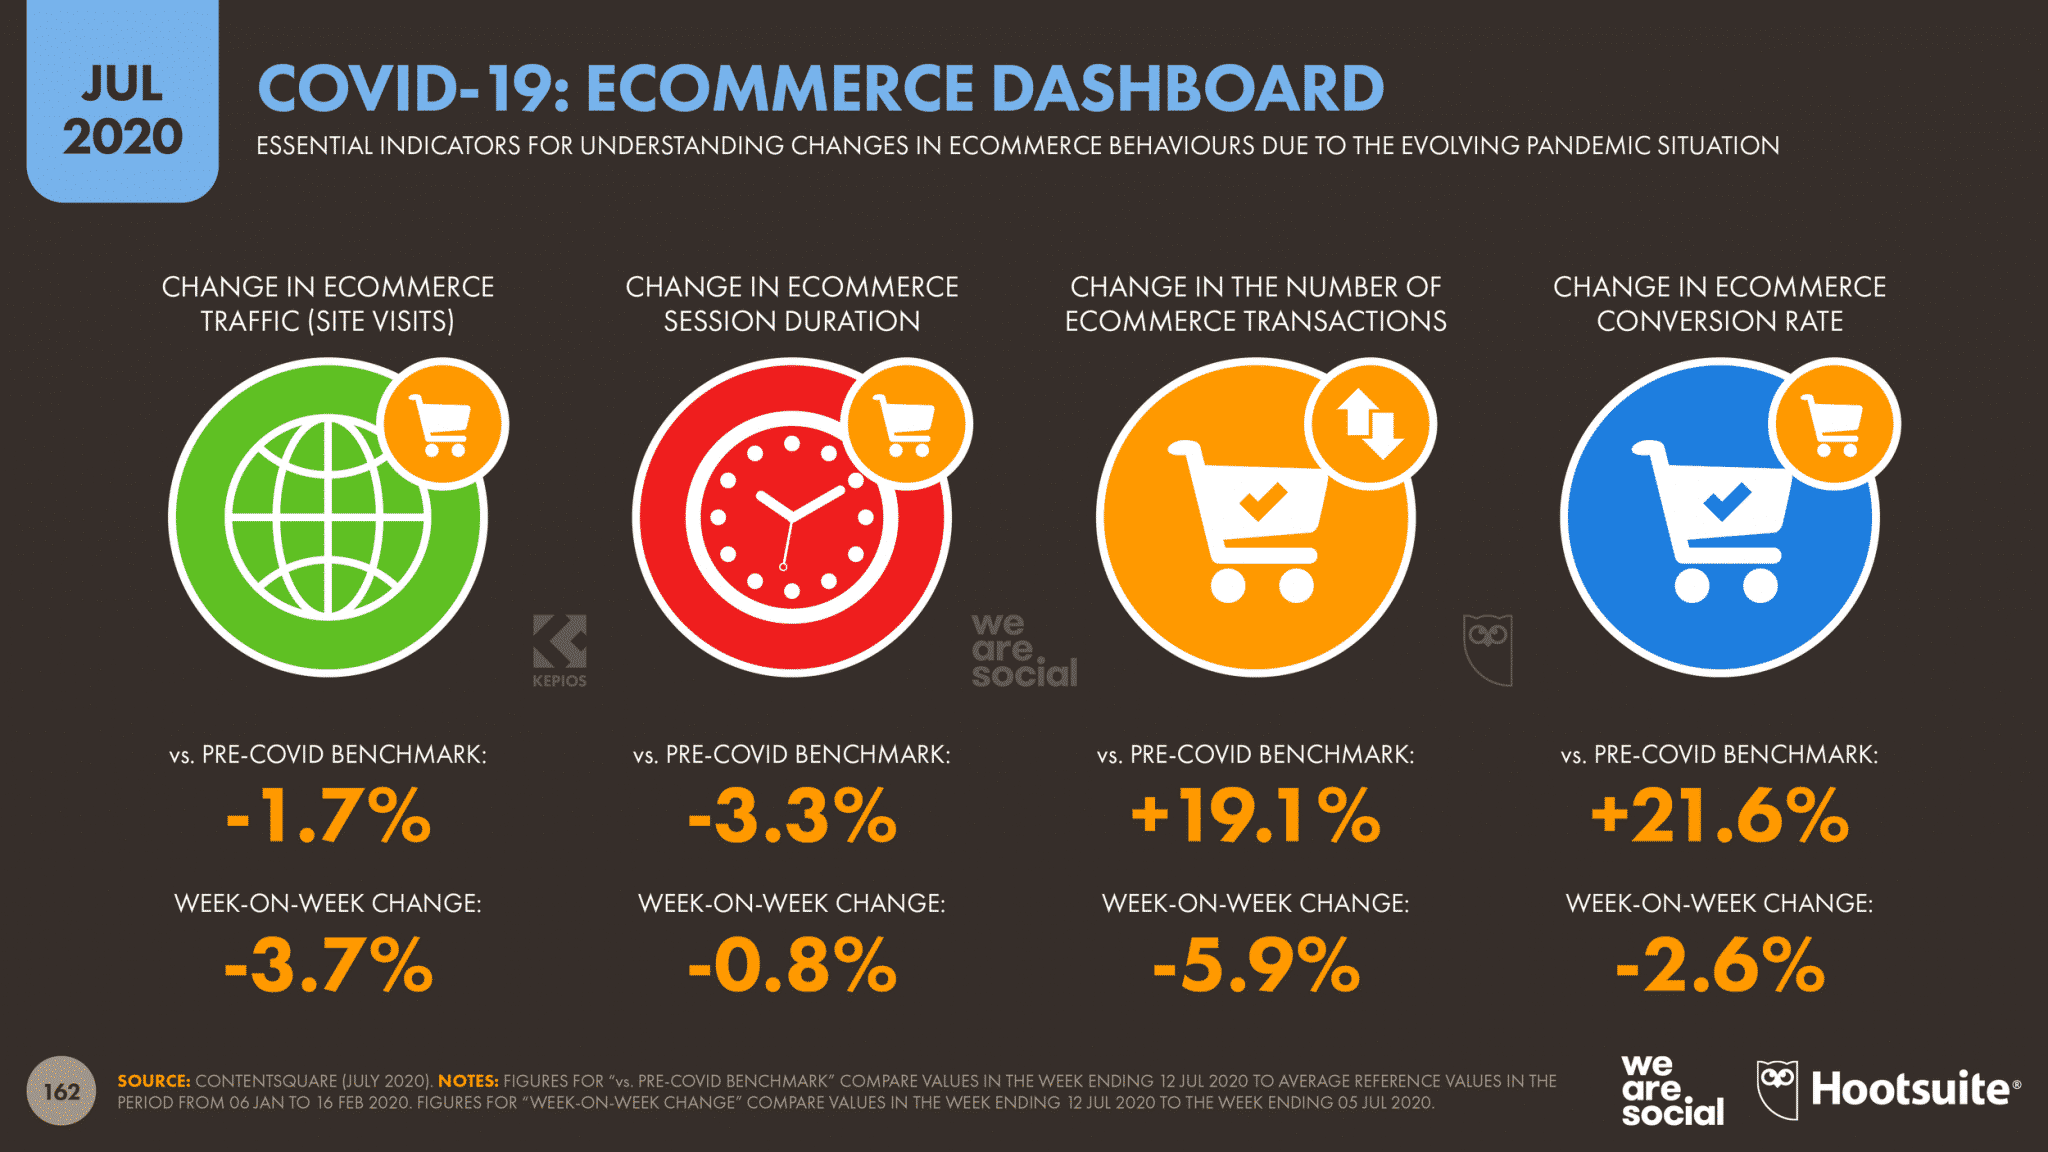
DataReportal has found that the COVID-19 restrictions have forced more shoppers online, with a 19% increase in the number of eCommerce transactions and a 22% increase in the eCommerce conversion rate. Further more, almost half of all internet users expected to use eCommerce more often even after the pandemic is over.
Now, it’s time to use some more statistics to help find your customers online.
Social Media Usage Statistics in 2020
Social Media usage continues to increase. According to Statista, we spend on average around 2.4 hours per day on social media.
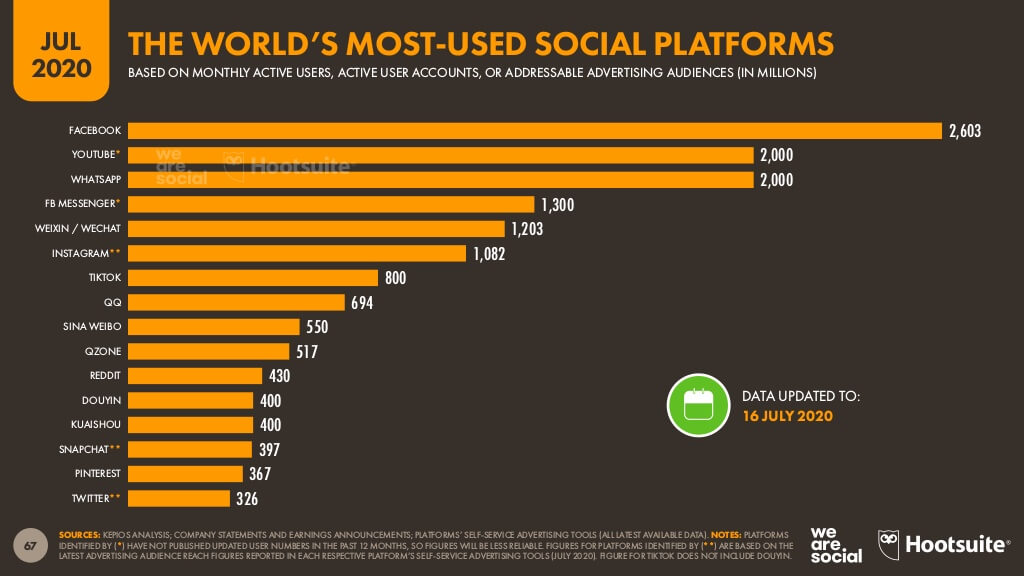
Despite new arrivals and some serious competition from competitors, Facebook still has the most usage every day.
Source: Smart Insights
Our social media plans always focus on the unique needs of your business. Facebook and Instagram will almost always be part of your plan, and the popularity of video content means a YouTube channel could be perfect for delivering engaging content to your audience.
LinkedIn and Twitter may not be as popular, however, they do have certain audiences that do prefer to use them. For example, if you’re targeting a professional demographic, LinkedIn is a great choice.
Not surprisingly, Datareportal notes that more than half of the world now uses social media and recently there has been a “monumental increase in online and digital activities” during the COVID-19 lockdown period.
Why Does This Data Matter?
We live and work by the ‘reach, measure, grow’ mantra every single day. We don’t believe in hunches. We believe in collecting data and using this data to deliver the insights your business needs to grow online.
We hope our internet usage statistics round-up helps you to better understand the landscape and to equip you with information about the latest trends that you can leverage these as part of your digital strategy.
